Nick Goold
New York Gold
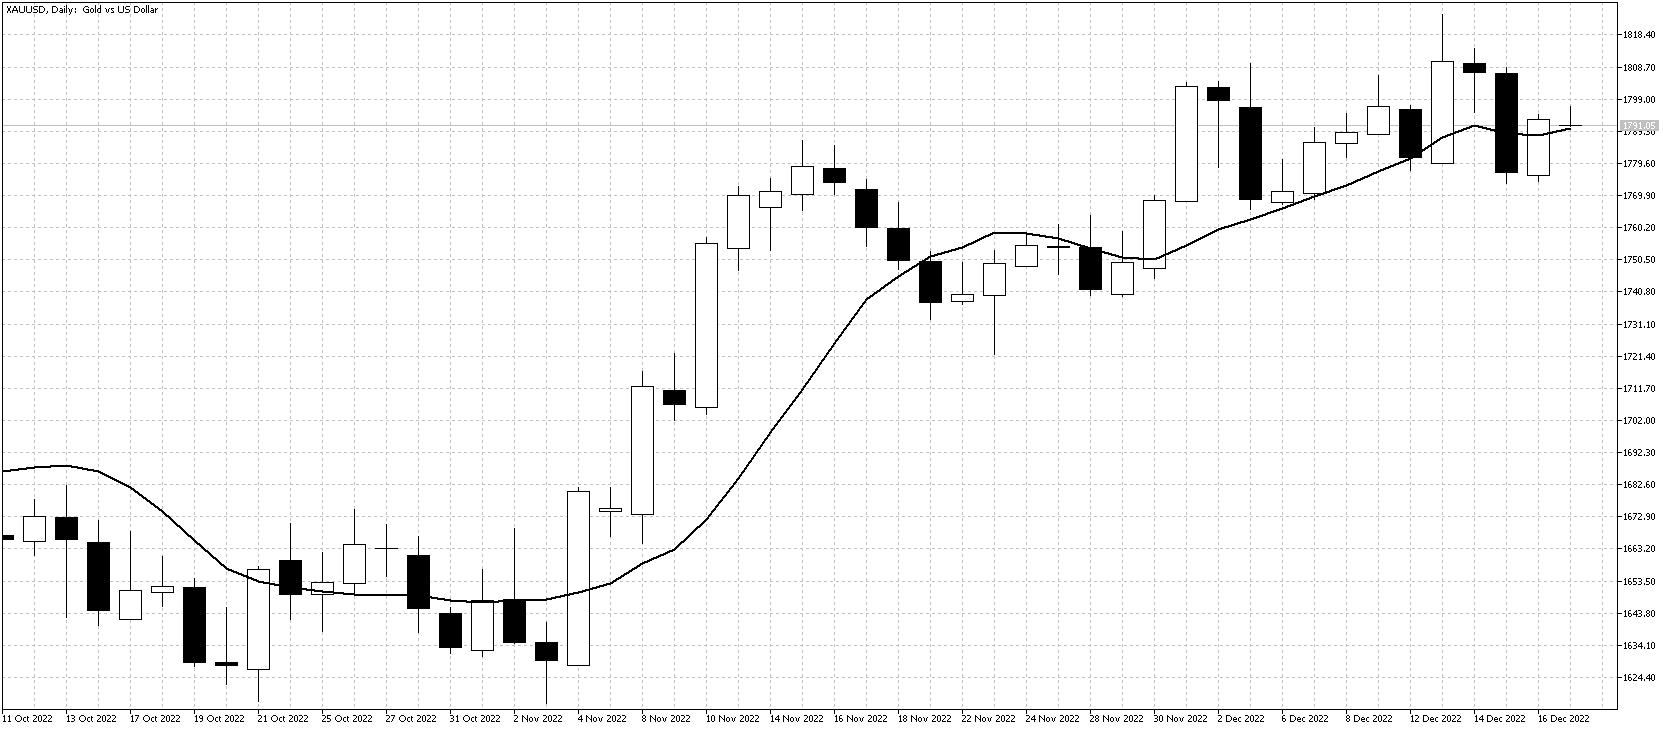
A volatile week for Gold with mixed economic data resulting in significant market moves. Following the weaker-than-expected US inflation figure, Gold made a new six-month high. Lower US inflation figures saw the US dollar weaker making Gold cheaper in USD for worldwide consumers. The USD is an essential driver of NY Gold prices.
The rise in US official interest rates and comments by Fed Chairman Powell that interest will remain high to fight inflation hurt Gold seeing prices fall below $1800 at the end of the week.
While the medium uptrend remains, short-term prices are vulnerable to falls. In the week before Christmas, no major news events could impact the market, and traders will focus on technical analysis. Should Gold move back $1800, the short-term uptrend will resume but currently, sideways to lower prices look most likely this week.

Resistance: 1806, 1810, 1850
Support: 1775, 1765, 1745, 1737, 1730, 1700
WTI
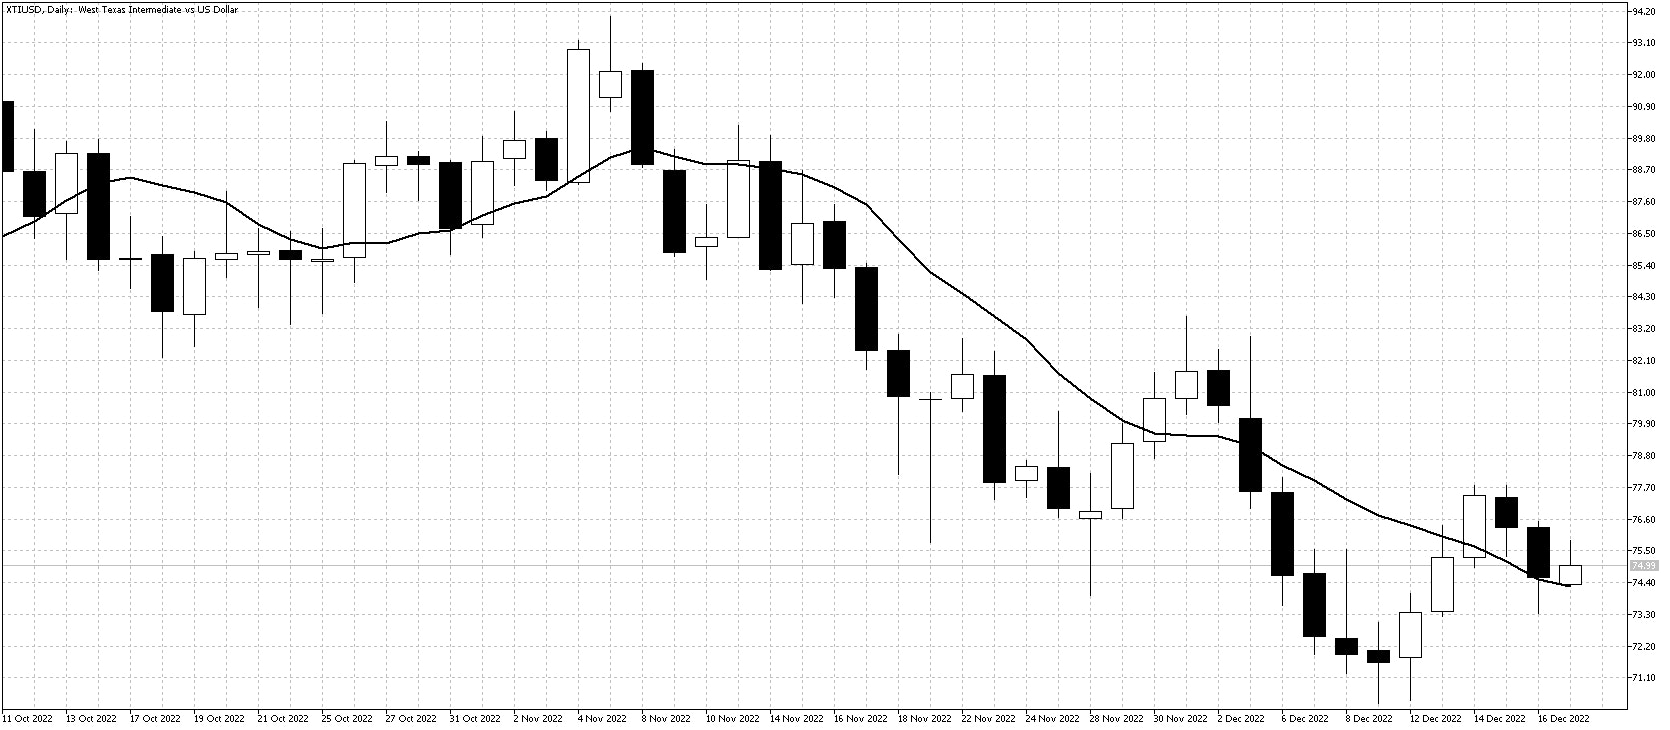
WTI prices recovered last week as a weaker USD helped market sentiment. However, once back above old support at $75, sellers returned to the market, preventing further gains. In addition, increased US interest rates and weaker-than-expected US retail sales saw the end of the week looking bearish again.
A week of range trading around the $75 level is the most likely scenario as traders look to reduce positions ahead of Christmas and New Year. The market can move more than expected in holiday trading conditions, producing range trading opportunities.

Resistance: 77.75, 80.00, 84.00, 90.00
Support: 70.00, 67.00, 62.30

