Nick Goold
What is Pivot Point Trading?
Pivot point trading is a popular technical analysis tool many successful FX day traders use to identify potential market support and resistance levels. By calculating pivot points using the previous day's high, low, and closing prices, traders can gain valuable insight into market conditions and adjust their trading strategies accordingly.
The most common method is the Standard Pivot Point Formula, which is:
Pivot Point (PP) = (High + Low + Close) / 3
Once you have calculated the pivot point, calculate the support and resistance levels based on this value.
The most commonly used levels are:
First Support (S1) = (2 x PP) - High
Second Support (S2) = PP - (High - Low)
Third Support (S3) = Low - 2 x (High - PP)
First Resistance (R1) = (2 x PP) - Low
Second Resistance (R2) = PP + (High - Low)
Third Resistance (R3) = High + 2 x (PP - Low)

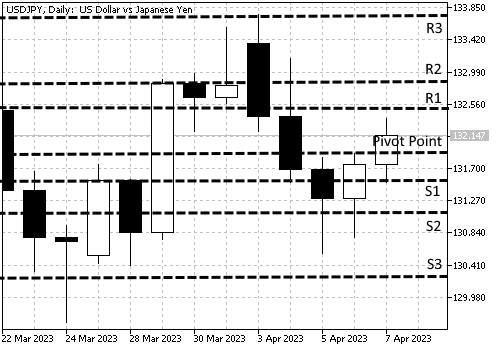
For example USDJPY
Close 131.76
High 132.37
Low 131.51
Pivot Point = 132.01
First Support (S1) = 131.65
Second Support (S2) = 131.15
Third Support (S3) = 130.29
First Resistance (R1) = 132.51
Second Resistance (R2) = 132.87
Third Resistance (R3) = 133.73
Range traders usually use pivot point trading, but it can also be adapted to trend trading.
Range trading with Pivot Points
Range traders will use pivot points to find entry points. For example, if the price reaches the first level of resistance and starts to move downwards, this could indicate to exit of a long position or enter a short one. Alternatively, if the price reaches the first level of support and starts to move upwards, this could indicate to exit of a short position or enter a long one.
Using pivot points as entry and exit points can be particularly useful for traders who prefer shorter time frames, such as day traders. It can help them quickly identify potential trading opportunities and adjust their positions accordingly. In addition, confirming pivot point support and resistance with high/low analysis can increase the profitability of using pivot points.
Trend trading with Pivot Points
Pivot Points can be used to indicate the market's trend by traders. For example, if the market opens above the pivot point, it could show bullish sentiment. As a result, traders may look for opportunities to enter long positions if the price rises from this level. Alternatively, suppose the market opens below the pivot point. In that case, it could be an indication of bearish sentiment, and traders may look for opportunities to enter short positions if the price starts to fall from this level. Pivot Points can be used with other technical indicators, such as moving averages, to confirm potential price movements. Traders can use Pivot Points to identify potential levels of support and resistance and use other indicators to confirm the strength of those levels.
Risk Management
Pivot points can also be helpful in risk management. For example, once a trader has identified potential entry and exit points using pivot points, they can also use them to determine their risk-to-reward ratio and set their stop-loss and take-profit levels accordingly.
For example, if a trader enters a long position based on a bullish sentiment indicated by the pivot point, they can set their stop-loss below the first level of support. This ensures that if the market moves against them and the price falls below the support level, their position will be automatically closed, limiting their losses. Similarly, they can set their take-profit level at or above the first level of resistance, ensuring that if the market moves in their favor and the price rises to this level, their position will be automatically closed, locking in their profits.
By using pivot points to set their stop-loss and take-profit levels, traders can limit their potential losses and maximize their profits. This helps to manage their risk and ensures that they have a clear risk-to-reward ratio for each trade, which is an essential component of any successful trading strategy.
In addition, traders can also use pivot points to identify potential areas of congestion or consolidation in the market, where the price may be more prone to sudden reversals. By identifying these areas and adjusting their stop-loss and take-profit levels accordingly, traders can further manage their risk and minimize their exposure to sudden market movements.
In summary, Pivot Points can be a helpful indicator for traders to define support and resistance levels and determine the market's trend. Pivot Points are more popular for day traders who rely on technical analysis than longer-term traders.

