
Aayush Jindal
Key Highlights
- USD/JPY again did not surpass the 159.00 resistance and dipped.
- A possible double top pattern could be formed at 159.00 on the 4-hour chart.
- EUR/USD started a minor recovery wave from the 1.1120 support.
- WTI Crude Oil prices might gain traction if there is a close above $98.00.
USD/JPY Technical Analysis
The US Dollar made another attempt to clear 159.00 against the Japanese Yen. USD/JPY failed to gain momentum, struggled to continue higher, and dipped.
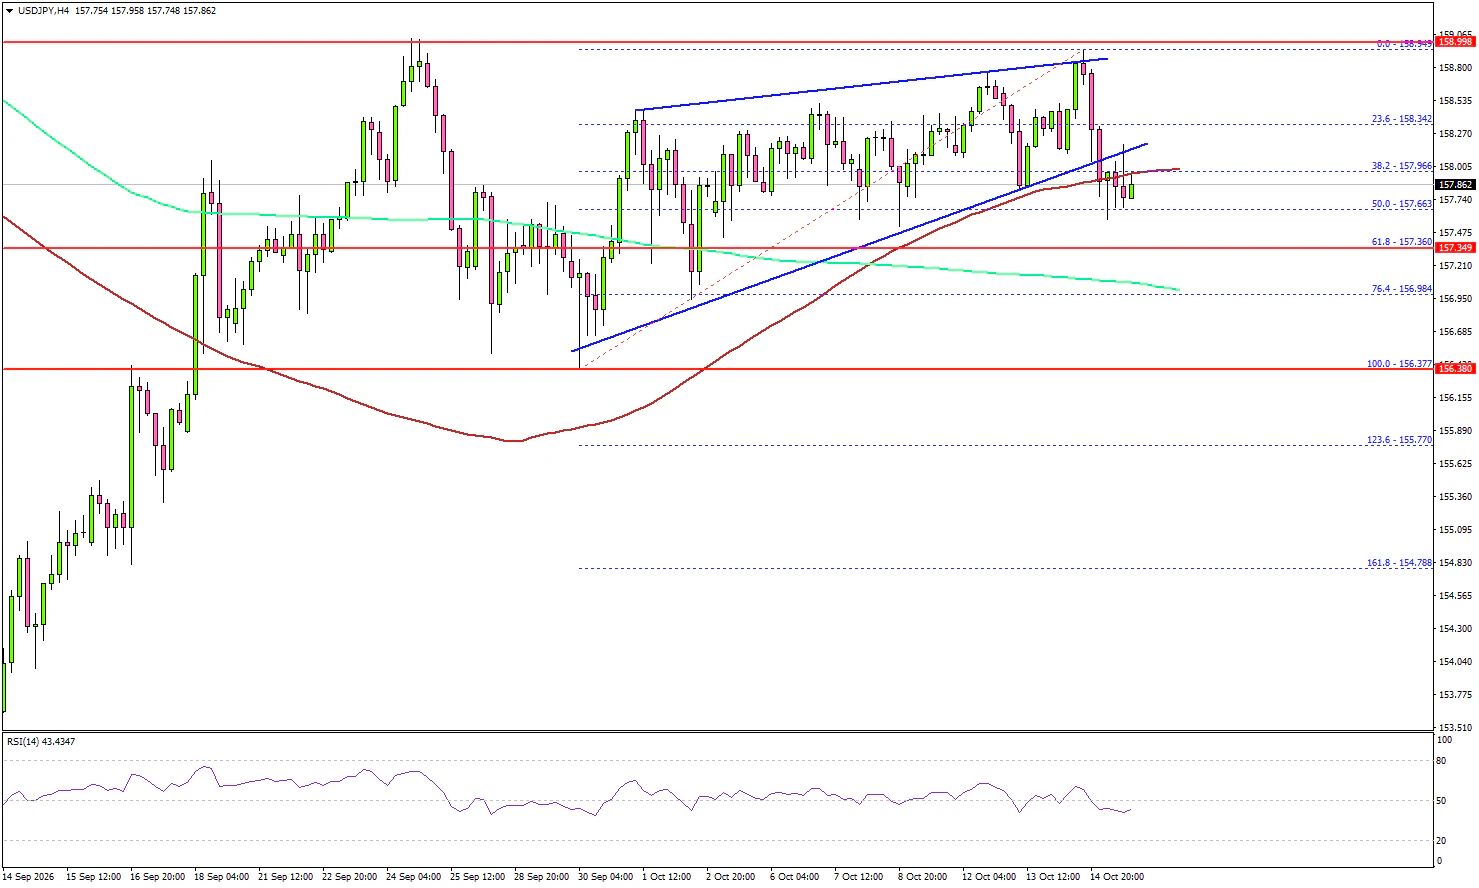
Looking at the 4-hour chart, the pair traded below a contracting triangle with support at 158.20. There was a dip to the 50% Fib retracement level of the upward move from the 156.37 swing low to the 158.54 high, and the 100 simple moving average (red, 4-hour).
Immediate support could be near the 61.8% Fib retracement level at 157.36. The first major support might be near the 200 simple moving average (green, 4-hour) and 157.00.
A close below 157.00 might accelerate the decline. In the stated case, the pair might drop to 155.50. If there is another increase, USD/JPY could face resistance near 158.40. The first major resistance might be 158.80.
The main hurdle could still be 159.00. A close above the 159.00 pivot level could start a steady increase. In the stated case, the pair might even surpass 160.00.
Looking at EUR/USD, the pair found some support near 1.1120 and might try a recovery wave if USD/JPY extends its decline.
Upcoming Key Economic Events:
- Fed's Chair Warsh speech.
- US Import Price Index for Sep 2026 (MoM) – Forecast +0.8%, versus +0.7% previous.
- US Export Price Index for Sep 2026 (MoM) – Forecast +1.0%, versus +0.6% previous.
- US Industrial Production for Sep 2026 (MoM) – Forecast +0.4%, versus 0% previous.