
Nick Goold
Average True Range (ATR) is a technical analysis indicator that measures the volatility of an asset by analyzing price movements over a specified period. The famous analyst J. Welles Wilder, Jr. developed the ATR indicator, which is used in many financial markets, especially in analyzing stocks, commodities, and currencies.
To calculate ATR take the average of the true range of an asset over a specified period. The standard measure of a market range is to calculate the difference between the high and low, but ATR uses the previous close, so gaps between the previous close and open are considered.
The true range is the greatest of the following:
- The difference between the current high and the current low
- The difference between the previous close and the current high
- The difference between the previous close and the current low
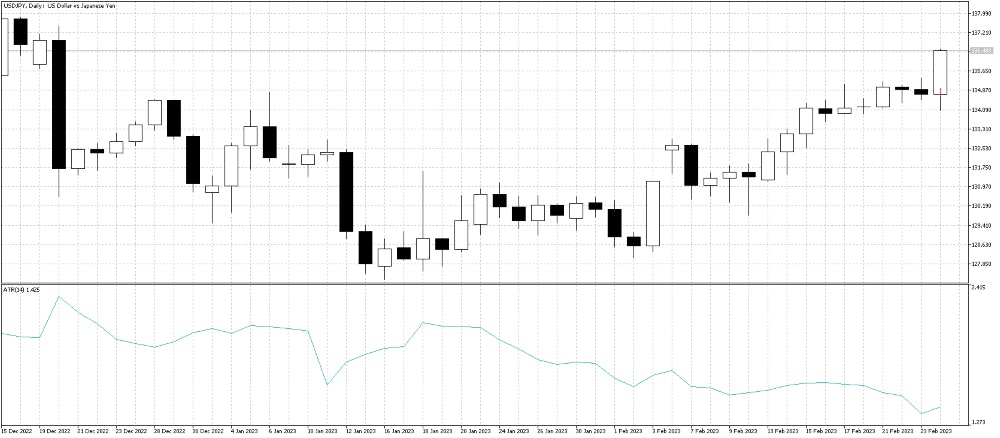
For each period, the true range is calculated, and then an average is calculated over 14 bars usually. For example, a daily ATR calculation will calculate the true range for each day for the past 14 days and calculate the average of each 14 days. A higher ATR value indicates greater volatility, while a lower ATR value indicates lower volatility.
How to use ATR to improve trading
Risk management
ATR can set stop loss, take profit levels, and assess a trade's potential risk and reward. A higher ATR may require a wider stop loss to account for possible price fluctuations, while a lower ATR may allow for a tighter stop loss.
If the 14-day ATR was 120 pips, a swing trader might set their stop at 50% of the ATR at 60 pips and a target of 200% of the ATR at 240 pips.
Alternatively, a day trader might use a 5-minute chart and calculate the ATR over the last 14 bars. For example, if the ATR was 10 pips, they might use a 50% ATR stop of 5 pips and a 100% ATR target of 10 pips.
Improving strategy performance
Entry and exit points
Traders can use ATR to identify a trade's potential entry and exit points. ATR can help determine when an asset is experiencing high levels of volatility, which may present opportunities to enter or exit a trade. When the ATR is low compared to historical levels, it could indicate that the market is due to trend, as no market stays quiet forever.
Trend identification
ATR can also be used to identify the strength of a trend. For example, if the ATR increases, it may indicate that the trend is gaining momentum, while a decreasing ATR may suggest that the trend is losing steam.
Alternatively, it is usually best to look for range trading opportunities when ATR is low and decreasing.
Market selection
ATR can be used to compare the volatility of different markets to improve market selection. Generally, markets with high ATR levels enjoy more trading opportunities and are more attractive to traders. When comparing ATR levels, analyzing each market's spreads is essential. For example, a market with a high ATR but a wide spread between the bid and offer prices is less attractive than a market with a slightly lower ATR but a much smaller spread.
The average true range (ATR) can be a helpful tool for traders to understand volatility easily and improve their risk management and assessment of trading opportunities. Combining ATR with other indicators like a moving average and support and resistance analysis can benefit short- and long-term traders.