
Aayush Jindal
Key Highlights
- WTI Crude Oil prices started a fresh decline below the $70.00 zone.
- A rising channel is forming with support at $66.50 on the 4-hour chart.
- Gold bulls are struggling to clear the $3,350 resistance.
- EUR/USD extended losses and corrected below the 1.1720 zone.
WTI Crude Oil Price Technical Analysis
WTI Crude Oil price failed to continue higher above $72.50 against the US Dollar. There was a strong bearish reaction below the $70.00 and $68.00 levels.
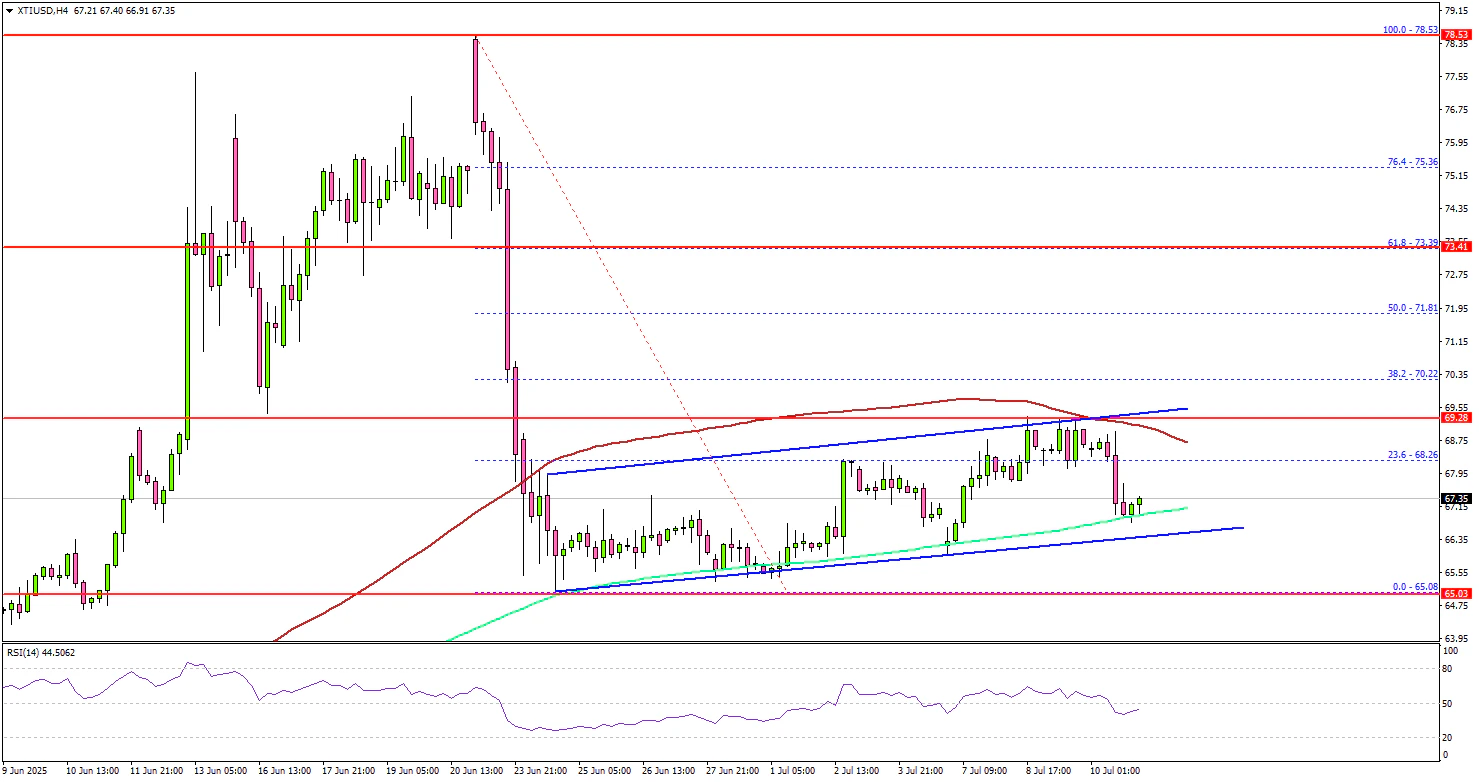
Looking at the 4-hour chart of XTI/USD, the price settled below the $70.00 level and the 100 simple moving average (red, 4-hour). A low was formed at $65.00, and the price recently started a consolidation phase.
There was a move above the $68.00 level, but the bears remained active near the 100 simple moving average (red, 4-hour). On the upside, immediate resistance is near the $68.0 level. The first key resistance sits near the $70.00 level.
The main hurdle is now near the $71.80 zone, above which the price may perhaps accelerate higher. In the stated case, it could even visit the $73.50 resistance. Any more gains might call for a test of the $75.00 resistance zone in the near term.
On the downside, the first major support sits near the $66.20 zone. The next support could be $65.00. A daily close below $65.00 could open the doors for a larger decline. The next major support is $63.40. Any more losses might send oil prices toward $62.00 in the coming days.
Looking at Gold, the bears are active below the $3,650 level, and they might aim for a drop toward the $3,260 level.
Economic Releases to Watch Today
- USDA WASDE Report.
- Baker Hughes US Oil Rig Count.
- Monthly Budget Statement (Jun).
