
Aayush Jindal
Key Highlights
- WTI Crude Oil started a fresh increase above the $84.00 zone.
- A bullish trend line is forming with support at $83.50 on the 4-hour chart of XTI/USD.
- Gold prices struggled to clear the $4,450 resistance.
- GBP/USD managed to remain stable above 1.3500 after the UK’s employment report.
WTI Crude Oil Price Technical Analysis
WTI Crude Oil prices formed a base above $80.50 against the US Dollar. The price started a fresh increase and traded above the $82.50 resistance.
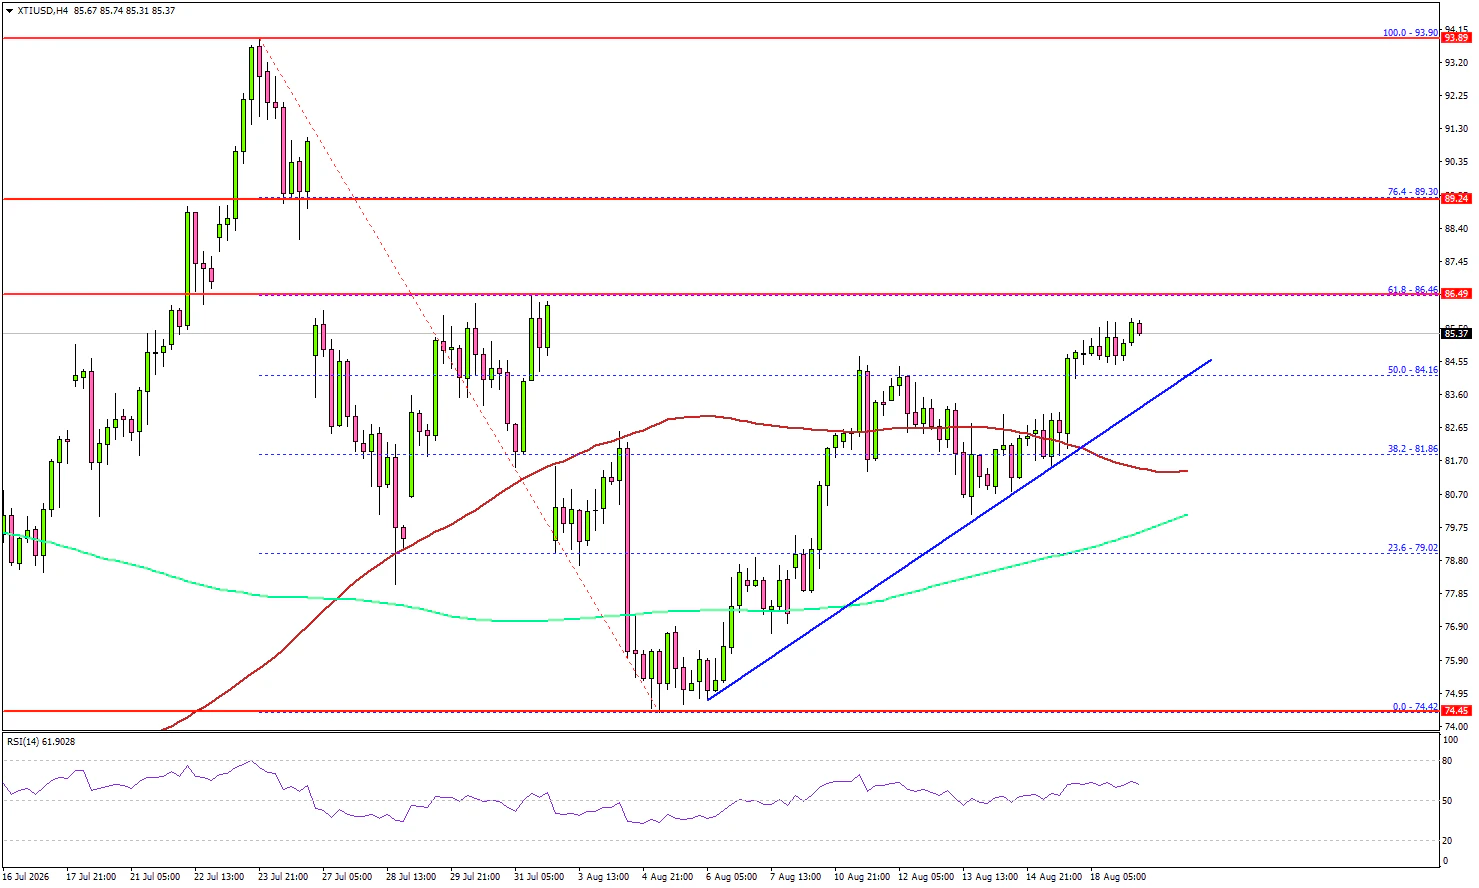
Looking at the 4-hour chart of XTI/USD, the price settled above the $84.00 level, the 100 simple moving average (red, 4-hour), and the 200 simple moving average (green, 4-hour). There was a clear move above the 50% Fib retracement level of the downward move from the $93.90 swing high to the $74.42 low.
On the upside, the price could face resistance at $86.50 and the 61.8% Fib retracement level. The next resistance might be $87.80. A close above $87.80 could send Oil prices toward $89.30.
If there is a pullback, the price might find support at $84.00. The first major support could be near the $83.50 zone. There is also a bullish trend line forming with support at $83.50. The next support might be $82.20. The main support might be $81.20 and the 100 simple moving average (red, 4-hour).
A close below $81.20 might even push the price toward $80.00 and the 200 simple moving average (green, 4-hour). Any more losses could open the door for a push below $76.50.
Looking at Gold, the price started a decent increase, but it must settle above $4,450 to continue higher in the near term.
Economic Releases to Watch Today
- ECB President Lagarde’s speech.
- FOMC Minutes.