
Aayush Jindal
Key Highlights
- WTI Crude Oil corrected gains and traded below $100 before the bulls appeared.
- A few key hurdles are forming near $100.60 and $102.60 on the 4-hour chart of XTI/USD.
- Gold could extend losses if there is a close below $4,450.
- Bitcoin declined below $75,000 before it recovered some losses.
WTI Crude Oil Price Technical Analysis
WTI Crude Oil prices declined heavily below $105 and $102 against the US Dollar. The price even dipped below $100 before the bulls stepped in.
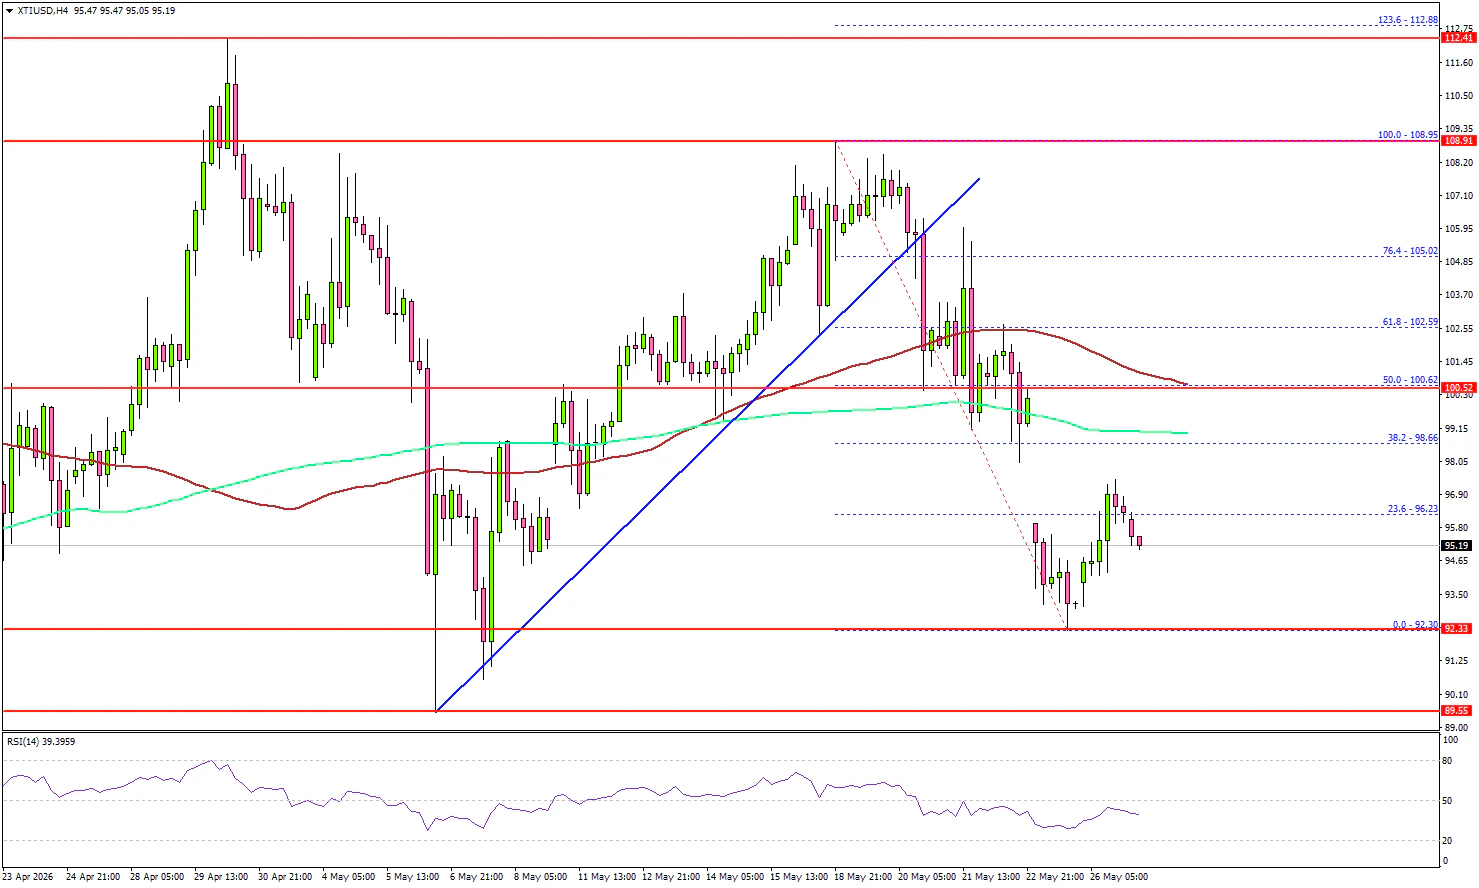
Looking at the 4-hour chart of XTI/USD, the price traded as low as $92.30. It settled below $100, the 100 simple moving average (red, 4-hour), and the 200 simple moving average (green, 4-hour).
Recently, there was a recovery wave above the 23.6% Fib retracement level of the downward move from the $108.95 swing high to the $92.30 low. On the upside, immediate resistance is near the $95.65 level.
The first key hurdle for the bulls could be $100.60, the 100 simple moving average (red, 4-hour), and the 50% Fib retracement level. A close above $100.60 might send Oil prices toward $102.60. Any more gains might call for a test of $105.00 in the near term.
On the downside, the first major support sits near the $94.20 zone. The next support could be $92.30, below which the price could dive and test $90.00. A daily close below $90.00 could open the doors for a larger decline. In the stated case, the bears might aim for a drop toward $85.00.
Looking at Gold, the bears are still active below the key resistance at $4,620. The main support sits at $4,450.
Economic Releases to Watch Today
- Fed's Logan speech.
- Richmond Fed Manufacturing Index for May 2026 – Forecast 4, versus 3 previous.