
Aayush Jindal
Key Highlights
- WTI Crude Oil extended losses below $92.00 and $90.00.
- A bearish trend line is forming with resistance at $92.50 on the 4-hour chart of XTI/USD.
- Gold prices could consolidate below $4,250 ahead of the Fed minutes.
- USD/JPY might start a fresh increase if it settles above 159.00.
WTI Crude Oil Price Technical Analysis
WTI Crude Oil prices failed to stay above $95.00 against the US Dollar. The price dipped below $93.20 and $92.00 to enter a short-term bearish zone.
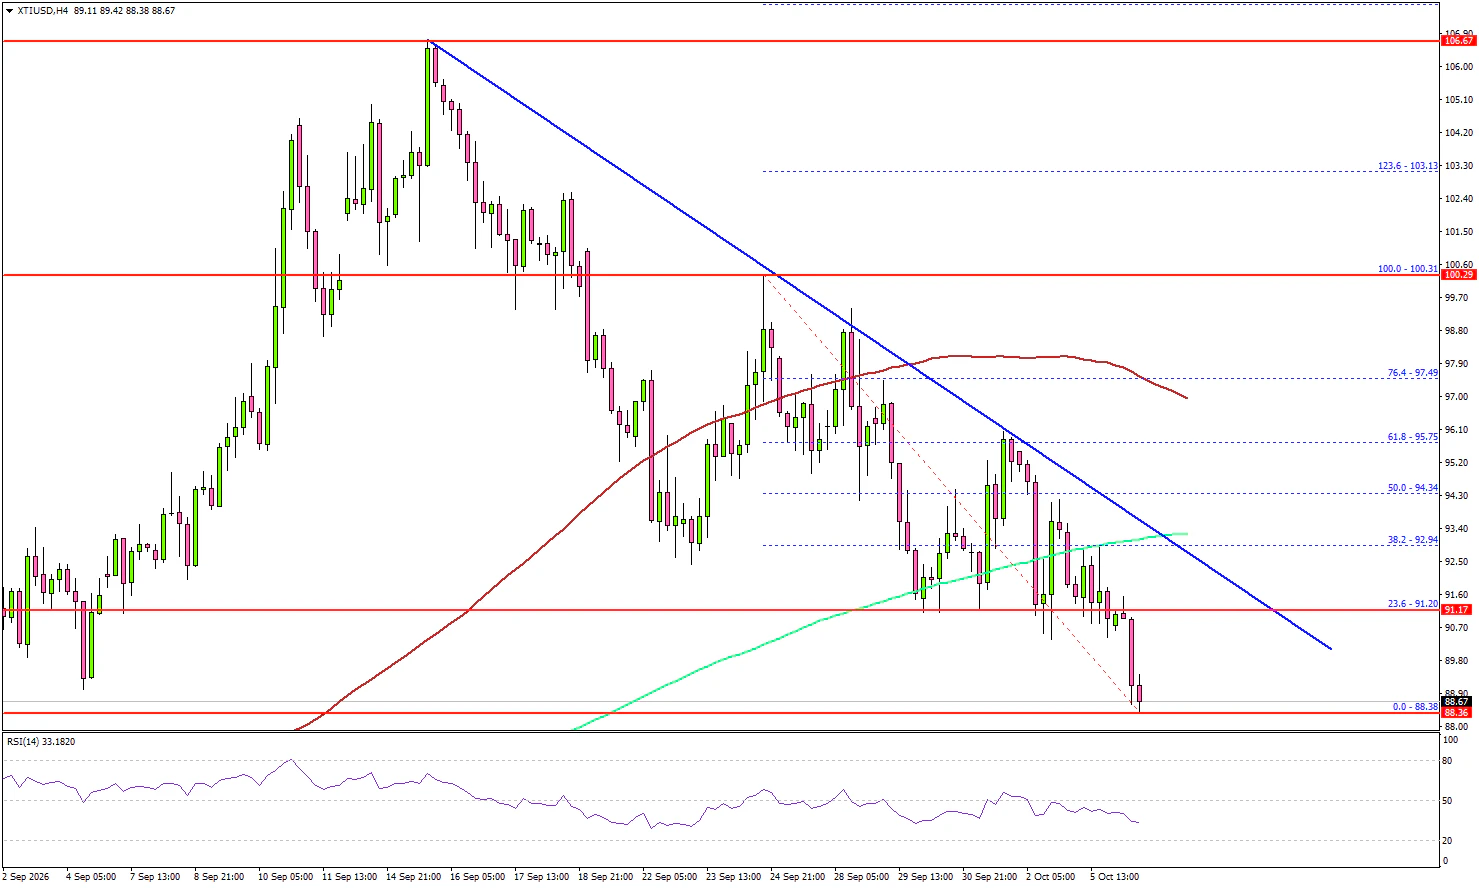
Looking at the 4-hour chart of XTI/USD, the price settled well below $92.50, the 100 simple moving average (red, 4-hour), and the 200 simple moving average (green, 4-hour). The bears even pushed the price below $90.00.
If there are more losses, the price might even test $86.50. The main support could be $85.00. A close below $85.00 could initiate a move to $80.00 in the coming days.
On the upside, the price could face resistance at $91.20. The first major resistance sits at $92.50 or the 200 simple moving average (green, 4-hour) at $93.00. There is also a bearish trend line forming with resistance at $92.50.
The next resistance might be $97.00 and the 100 simple moving average (red, 4-hour). A close above $97.00 could send Oil prices toward $100.00. The main resistance could now be $102.50.
Looking at Gold, the bears remained in action, but downside might be limited as we move closer to the Fed minutes.
Economic Releases to Watch Today
- FOMC Minutes.
- EIA Crude Oil Stocks Change.
- EIA Distillate Stocks Change.
- EIA Gasoline Stocks Change.
- EIA Heating Oil Stocks Change.