
Aayush Jindal
Key Highlights
- WTI Crude Oil price started a recovery wave from the $67.00 zone.
- It broke a key bearish trend line with resistance at $70.60 on the 4-hour chart.
- EUR/USD could struggle to recover above the 1.0920 resistance.
- GBP/USD faces hurdles near the 1.3020 resistance.
WTI Crude Oil Price Technical Analysis
WTI Crude Oil price extended losses below $70.00 before the bulls appeared. It tested $67.00 and recently started a recovery wave.
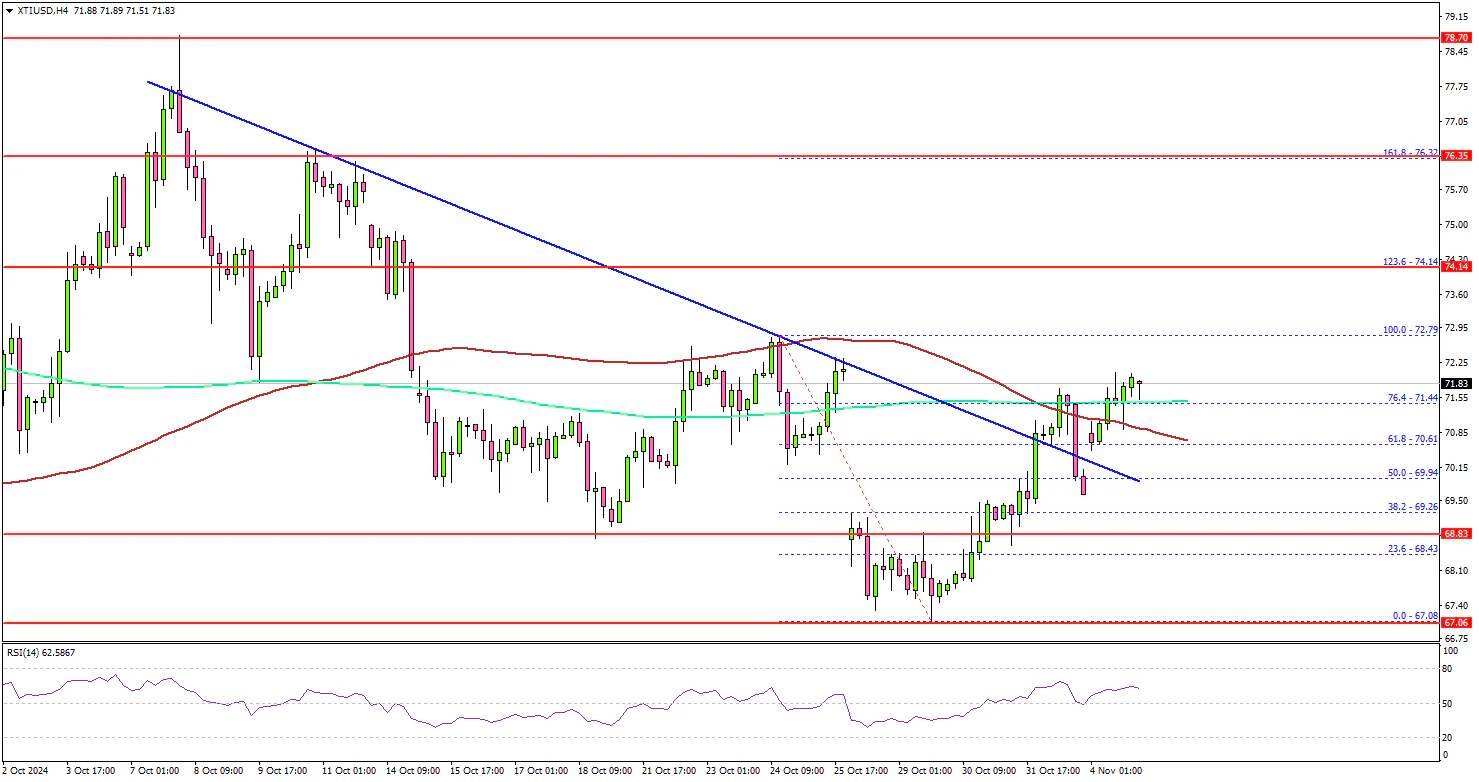
Looking at the 4-hour chart of XTI/USD, the price recovered above the $69.20 and $70.00 resistance levels. There was a move above the 61.8% Fib retracement level of the downward move from the $72.9 swing high to the $67.08 low.
Besides, it broke a key bearish trend line with resistance at $70.60 on the same chart. The price even attempted a close above the 100 simple moving average (red, 4-hour) and the 200 simple moving average (green, 4-hour).
On the upside, it faces resistance near the $72.80 level. The next major resistance is near the $74.15 zone. It is close to the 1.236 Fib extension level of the downward move from the $72.9 swing high to the $67.08 low, above which the price may perhaps accelerate higher.
In the stated case, it could even visit the $76.20 resistance. Any more gains might call for a test of the $78.50 resistance zone in the near term.
On the downside, the first major support sits near the $70.00 zone. A daily close below $70.00 could open the doors for a larger decline. The next major support is $68.50. Any more losses might send oil prices toward $67.00 in the coming days.
Looking at EUR/USD, the pair is consolidating losses above the 1.0800 zone and faces many hurdles near the 1.0920 zone.
Economic Releases to Watch Today
- US S&P Global Services PMI for Oct 2024 – Forecast 55.3, versus 55.3 previous.
- US ISM Manufacturing Index for Feb 2024 – Forecast 53.8, versus 54.9 previous.
