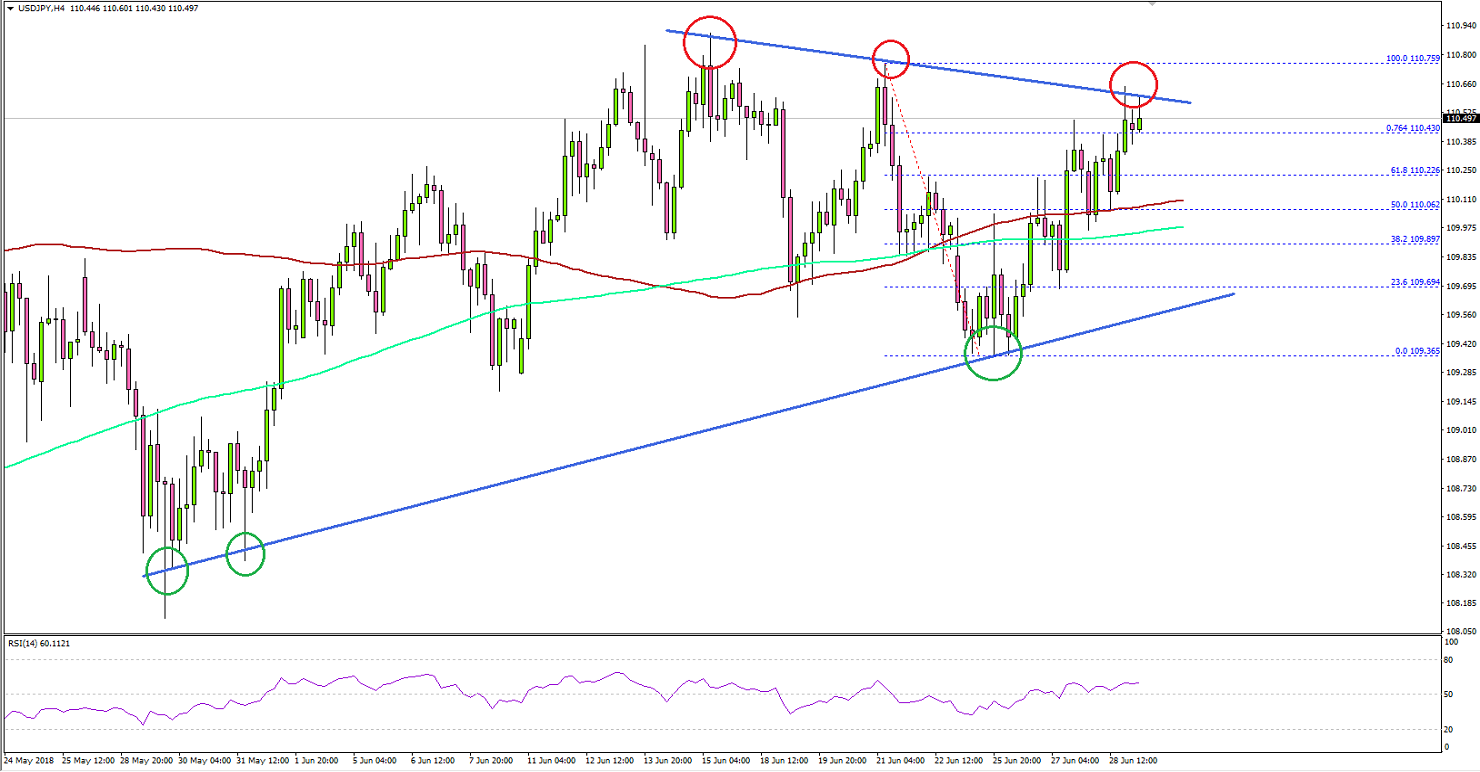
The US Dollar is trading in a positive zone above the 109.60 support against the Japanese Yen.
There is a major contracting triangle formed with resistance near 110.50-60 on the 4-hours chart of USD/JPY.
The US GDP in Q1 2018 grew 2%, less than the forecast of 2.2%.
Tokyo’s CPI in June increased 0.6% (YoY), compared with the forecast of 0.5%.
USDJPY Technical Analysis
The US Dollar started an upward move from the 109.36 swing low against the Japanese Yen. However, the USD/JPY pair must clear the 110.50-110.60 resistance zone to gain upside momentum.After forming a low at 109.36, the pair moved higher and broke the 50% Fib retracement level of the last decline from the 110.75 high to 109.36 low. More importantly, the pair traded above the 110.00 level and the 100 simple moving average (red, 4-hours).However, the upside move faced resistance near the 110.50 level and the 76.4% Fib retracement level of the last decline from the 110.75 high to 109.36 low. It seems like there is a major contracting triangle formed with resistance near 110.50-60 on the 4-hours chart of USD/JPY.On the downside, there is a strong support formed around 109.50. Therefore, as long as the pair is above 109.50, it could move above 110.60 resistance. If not, there is a risk of a bearish break towards the 109.00 level.Recently in the US, the Gross Domestic Product Annualized for Q1 2018 was released by the US Bureau of Economic Analysis. The market was looking for a growth of 2.2% in Q1 2018, but the actual was a bit lower since there the GDP came in at 2%.The US GDP Price Index in Q1 2018 increased 2.2%, more than the forecast of 1.9%. The report stated that:
The increase in real GDP in the first quarter reflected positive contributions from nonresidential fixed investment, PCE, exports, federal government spending, and state and local government spending that were partly offset by negative contributions from residential fixed investment and private inventory investment. Imports, which are a subtraction in the calculation of GDP, increased.
The US Dollar corrected lower after the release, but it is still well supported on the downside. EUR/USD and GBP/USD may correct higher, but upsides are likely to be capped in the near term.
Economic Releases to Watch Today
Germany’s Unemployment Change for June 2018 - Forecast -8K, versus -11K previous.
Germany’s Unemployment Rate for June 2018 – Forecast 5.2%, versus 5.2% previous.
UK GDP for Q1 2018 (QoQ) - Forecast +0.1% versus +0.1% previous.
Euro Zone CPI for June 2018 (YoY, Preliminary) - Forecast +2.0%, versus +1.9% previous.
Euro Zone Core CPI for June 2018 (YoY, Preliminary) - Forecast +1.0%, versus +1.1% previous.
US Personal Income for May 2018 (MoM) - Forecast +0.4%, versus +0.3% previous.
Canadian Gross Domestic Product for April 2018 (MoM) – Forecast 0.0%, versus +0.3% previous.

 After forming a low at 109.36, the pair moved higher and broke the 50% Fib retracement level of the last decline from the 110.75 high to 109.36 low. More importantly, the pair traded above the 110.00 level and the 100 simple moving average (red, 4-hours).However, the upside move faced resistance near the 110.50 level and the 76.4% Fib retracement level of the last decline from the 110.75 high to 109.36 low. It seems like there is a major contracting triangle formed with resistance near 110.50-60 on the 4-hours chart of USD/JPY.On the downside, there is a strong support formed around 109.50. Therefore, as long as the pair is above 109.50, it could move above 110.60 resistance. If not, there is a risk of a bearish break towards the 109.00 level.Recently in the US, the Gross Domestic Product Annualized for Q1 2018 was released by the US Bureau of Economic Analysis. The market was looking for a growth of 2.2% in Q1 2018, but the actual was a bit lower since there the GDP came in at 2%.
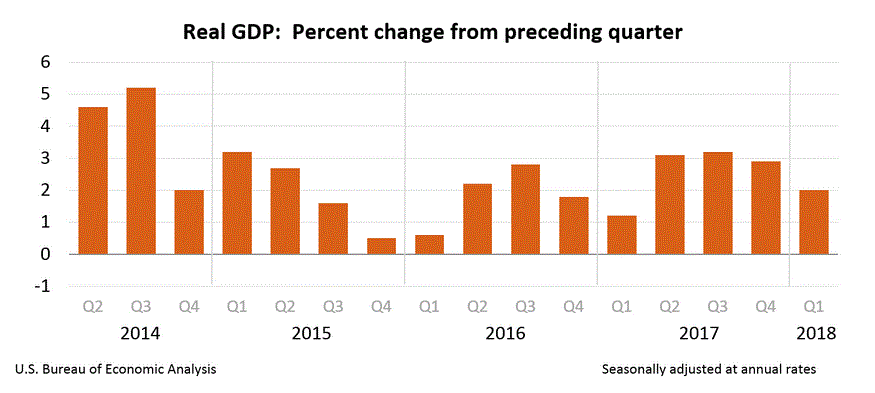 The US GDP Price Index in Q1 2018 increased 2.2%, more than the forecast of 1.9%. The report stated that:
