
Aayush Jindal
Key Highlights
- Gold price started a fresh increase from the $1,670 support.
- A key bearish trend line is forming with resistance near $1,732 on the 4-hours chart of XAU/USD.
- The US CPI increased 0.1% in May 2020 (YoY), less than the 0.2% forecast.
- The US Initial Jobless Claims in the week ending June 06, 2020 could decline from 1877K to 1550K.
Gold Price Technical Analysis
Earlier this month, gold price declined sharply from the $1,745 zone against the US Dollar. The price broke many supports near $1,700 to enter a short term bearish zone.
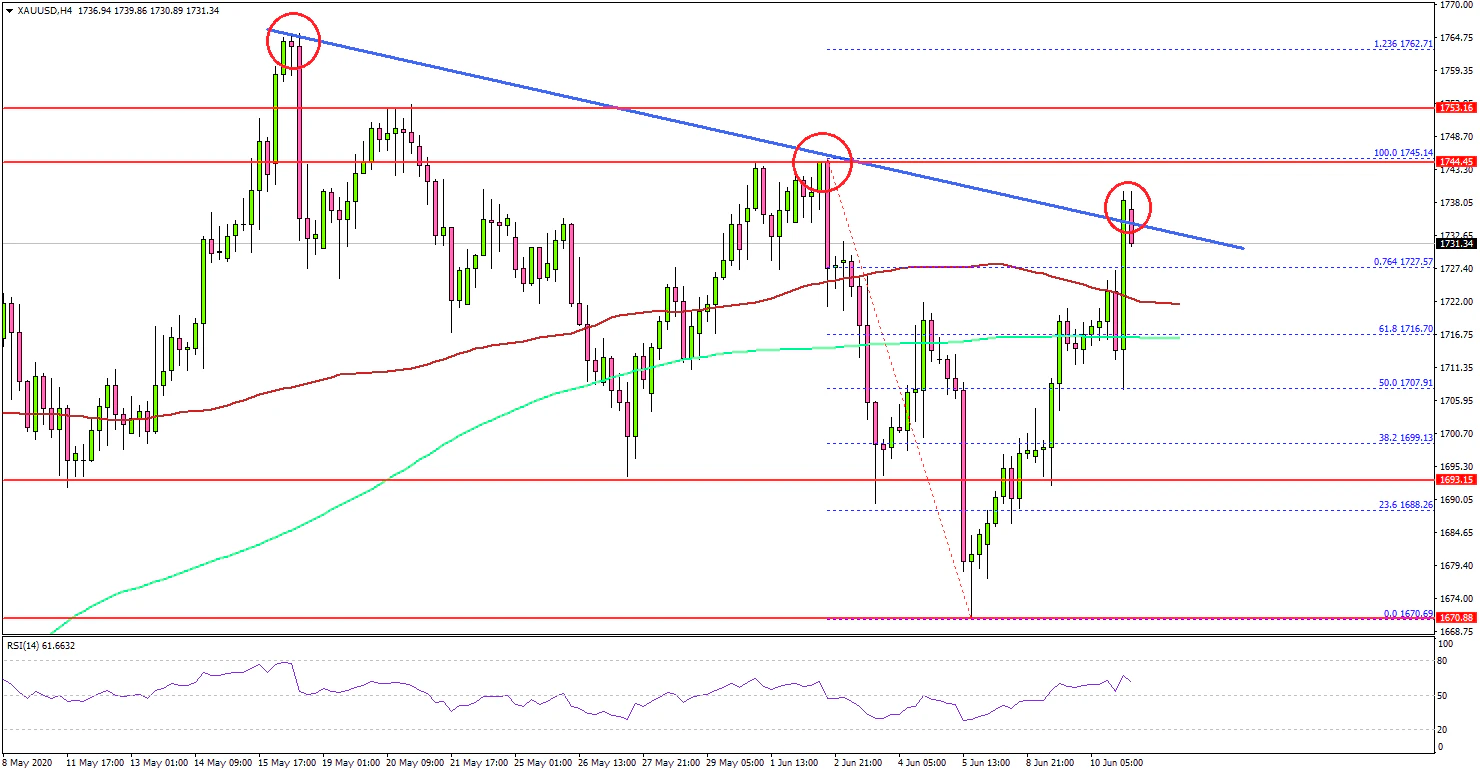
The 4-hours chart of XAU/USD indicates that the price traded to a new monthly low at $1,670. Recently, it started a fresh upward move and broke the key $1,700 resistance zone.
There was a break above the 50% Fib retracement level of the downward move from the $1,745 high to $1,670 low. The price even traded above the 100 simple moving average (red, 4-hours) and the 200 simple moving average (green, 4-hours).
On the upside, there is a major hurdle waiting near the $1,735 level. There is also a key bearish trend line forming with resistance near $1,732 on the same chart. If there is a successful break and close above the trend line, the price could continue to rise towards the $1,745 and $1,750 resistance levels.
Conversely, there is a risk of a fresh bearish wave below the $1,710 and $1,700 levels. The first major support is near the $1,690 level, below which it could move back towards the $1,670 level.
Fundamentally, the US Consumer Price Index for May 2020 was released by the US Bureau of Labor Statistics. The market was looking for a 0.2% increase in the CPI in May 2020, compared with the same month a year ago.
The actual result was below the market forecast, as the US CPI increased 0.1% in May 2020 (YoY). Looking at the monthly change, there was a 0.1% decline in the CPI.
The report added:
The index for all items less food and energy fell 0.1 percent in May, its third consecutive monthly decline. This is the first time this index has ever declined in three consecutive months.
Overall, gold price is facing a major hurdle near the $1,730 level, above which it could rally again. Looking at EUR/USD and GBP/USD, both pairs gained traction and traded to a new monthly high.
Economic Releases to Watch Today
- US Initial Jobless Claims - Forecast 1550K, versus 1877K previous.
- US Producer Price Index May 2020 (YoY) – Forecast -1.2%, versus -1.2% previous.
