
Aayush Jindal
Key Highlights
- Crude oil price is showing positive signs above $108.
- A connecting bullish trend line is forming with support near $109.20 on the 4-hours chart.
- Gold price might rise further if it stays above the $1,835 support.
- The US GDP could contract 1.4% in Q1 2022 (Prelim).
Crude Oil Price Technical Analysis
After a sharp downside correction from $115.50, crude oil price found support near $103.00 against the US Dollar. The price started a fresh increase above the $105.00 resistance.
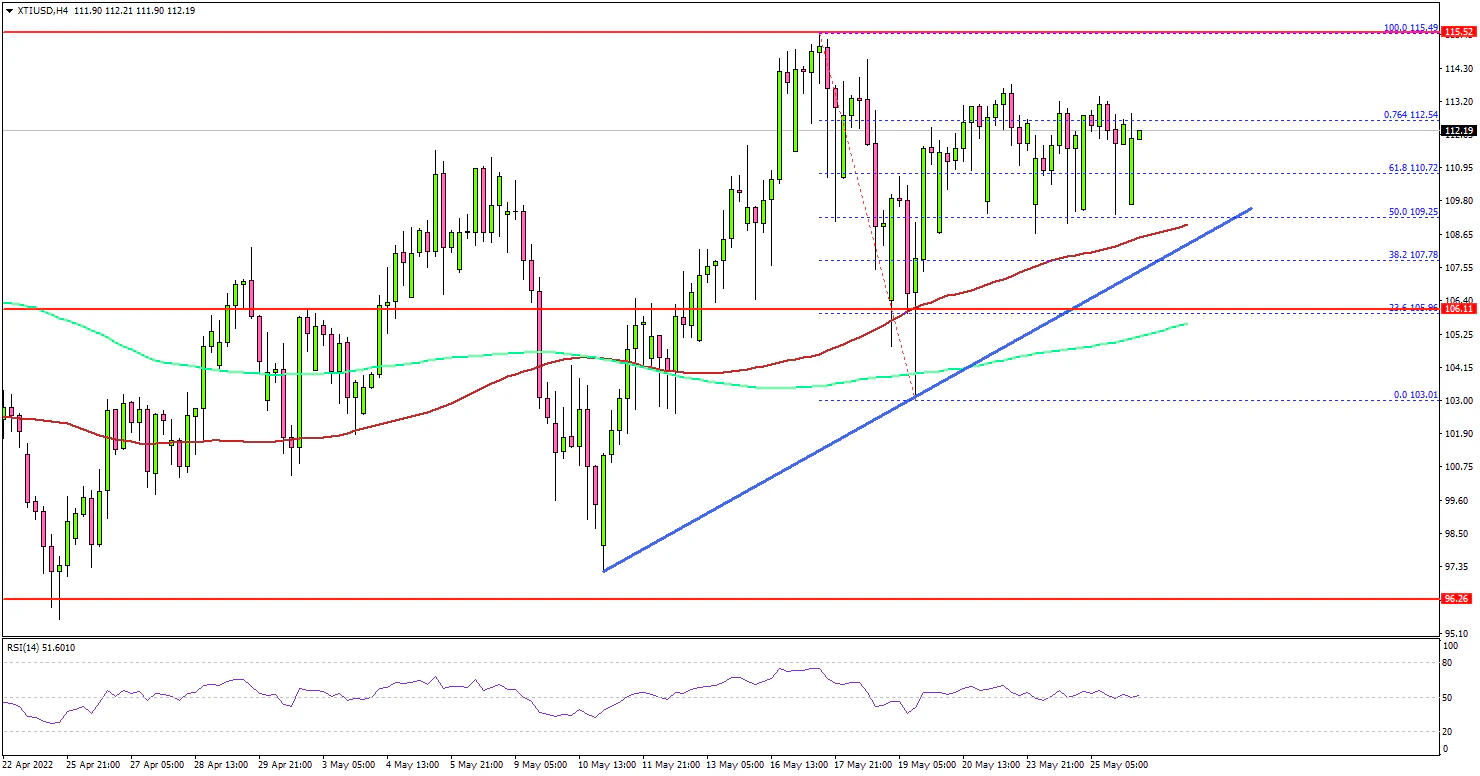
Looking at the 4-hours chart of XTI/USD, the price was able to settle above the $108.00 resistance, the 100 simple moving average (red, 4-hours), and the 200 simple moving average (green, 4-hours).
The bulls pushed the price above the 50% Fib retracement level of the downward move from the $115.49 swing high to $103.01 low. There was also a move above the $112.50 resistance zone.
If the bulls remain in action, the price could attempt a strong move above the $113.50 resistance. The next major resistance is near $115.50, above which the price could accelerate higher towards the $118.00 level.
If there is no upside break, the price could start another decline below $110. The next major support is near $109. There is also a connecting bullish trend line forming with support near $109.20 on the same chart.
The main support sits near $108, below which there is a risk of a move towards the $105.50 level. Any more losses might call for a test of the $102 support.
Looking at the gold price, the price attempted an upside break above the $1,870 level but there was no real bullish momentum. However, there is a strong support near $1,835.
Economic Releases to Watch Today
- US GDP for Q1 2022 (Prelim) - Forecast -1.4%, versus -1.4% previous.
- US Initial Jobless Claims - Forecast 215K, versus 218K previous.
