
Aayush Jindal
Key Highlights
- Gold found support near $4,065 and started a recovery wave.
- A bearish trend line is forming with resistance at $4,225 on the 4-hour chart.
- WTI Crude Oil started a consolidation phase above the $91.20 support.
- Bitcoin price saw a couple of swing moves from the $84,500 pivot level.
Gold Price Technical Analysis
Gold remained well-bid above $4,050 against the US Dollar. The price formed a base and started a recovery wave above $4,120.
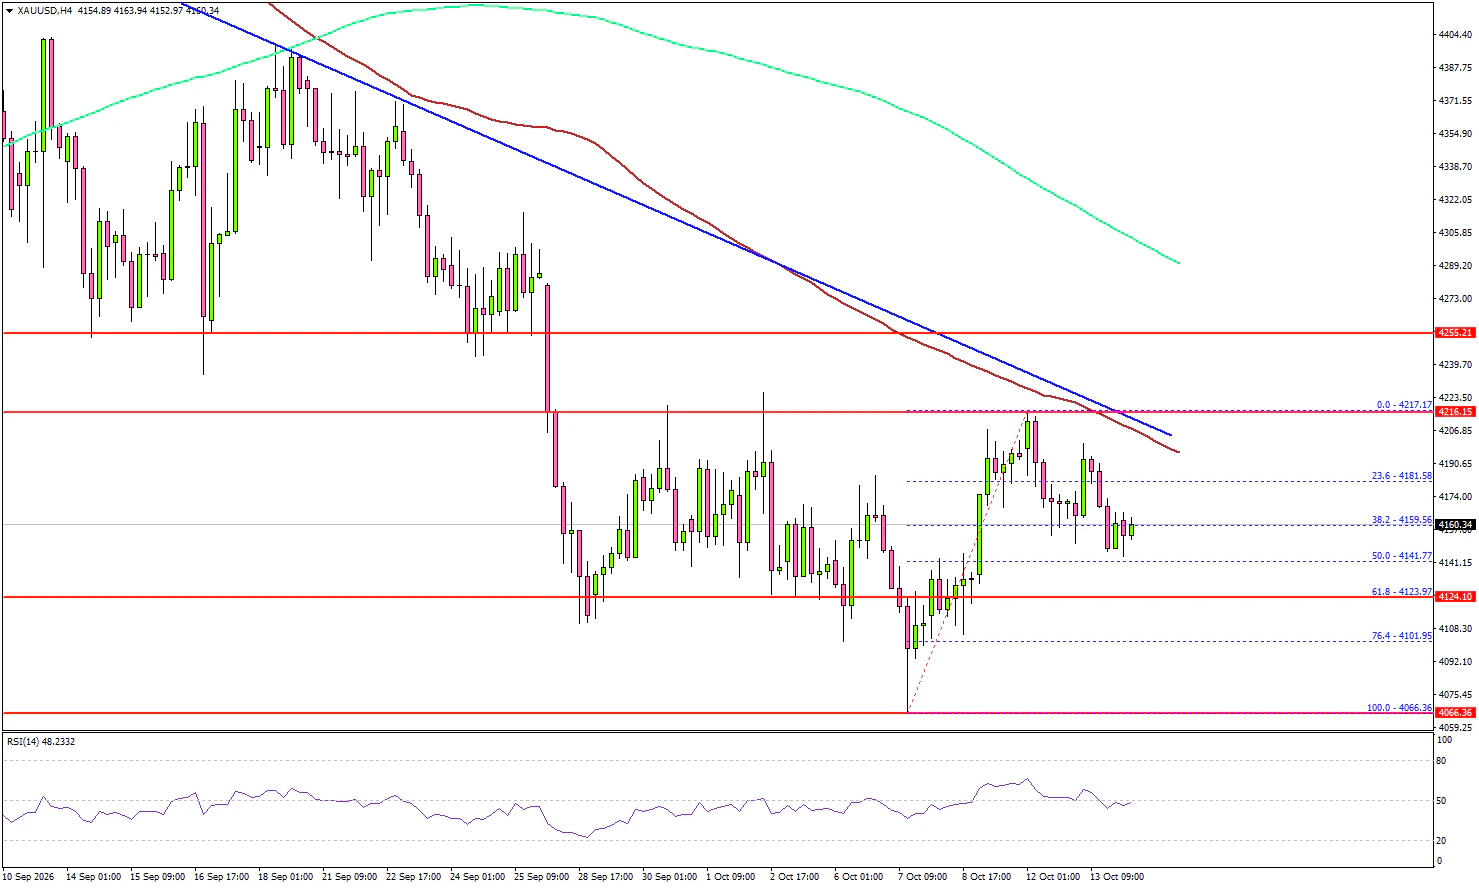
The 4-hour chart of XAU/USD indicates that the price surpassed the $4,200 level but remained below the 100 Simple Moving Average (red, 4 hours) and the 200 Simple Moving Average (green, 4 hours). There is also a bearish trend line forming with resistance at $4,225.
A close above the trend line resistance and the 100 Simple Moving Average (red, 4 hours) could fuel a fresh increase. The first key resistance could be $4,260.
The main resistance might be near the 200 Simple Moving Average (green, 4 hours) at $4,320. A clear move above $4,320 could open the door for more upside. In the stated case, the bulls could aim for a move toward $4,500.
If there is a fresh decline, the price could test $4,120. The first major support sits at $4,065. The next support could be $4,050, below which the price might slide to $3,965.
Looking at WTI Crude Oil, the bulls are showing strength, but a close above $94.50 could only open the doors for a recovery wave.
Economic Releases to Watch Today
- US Consumer Price Index for Sep 2026 (MoM) – Forecast +0.6%, versus +0.4% previous.
- US Consumer Price Index for Sep 2026 (YoY) – Forecast +3.6%, versus +3.4% previous.
- US Consumer Price Index Ex Food & Energy for Sep 2026 (YoY) – Forecast +2.5%, versus +2.4% previous.