
Aayush Jindal
Key Highlights
- Gold price failed once again near the $1,435resistance area against the US Dollar.
- A major bullish trend line is forming withsupport near $1,396 on the 4-hours chart of XAU/USD.
- The US ADP Employment changed 102K in June 2019,less than the 140K forecast.
- The Euro Zone Retail Sales in May 2019 might rise0.3% (MoM), up from the last -0.4%.
Gold Price Technical Analysis
After testing the $1,380-$1,382 support area, gold price climbed higher this week against the US Dollar. The price traded above the $1,420 resistance, but it failed once again near the $1,435 resistance area.
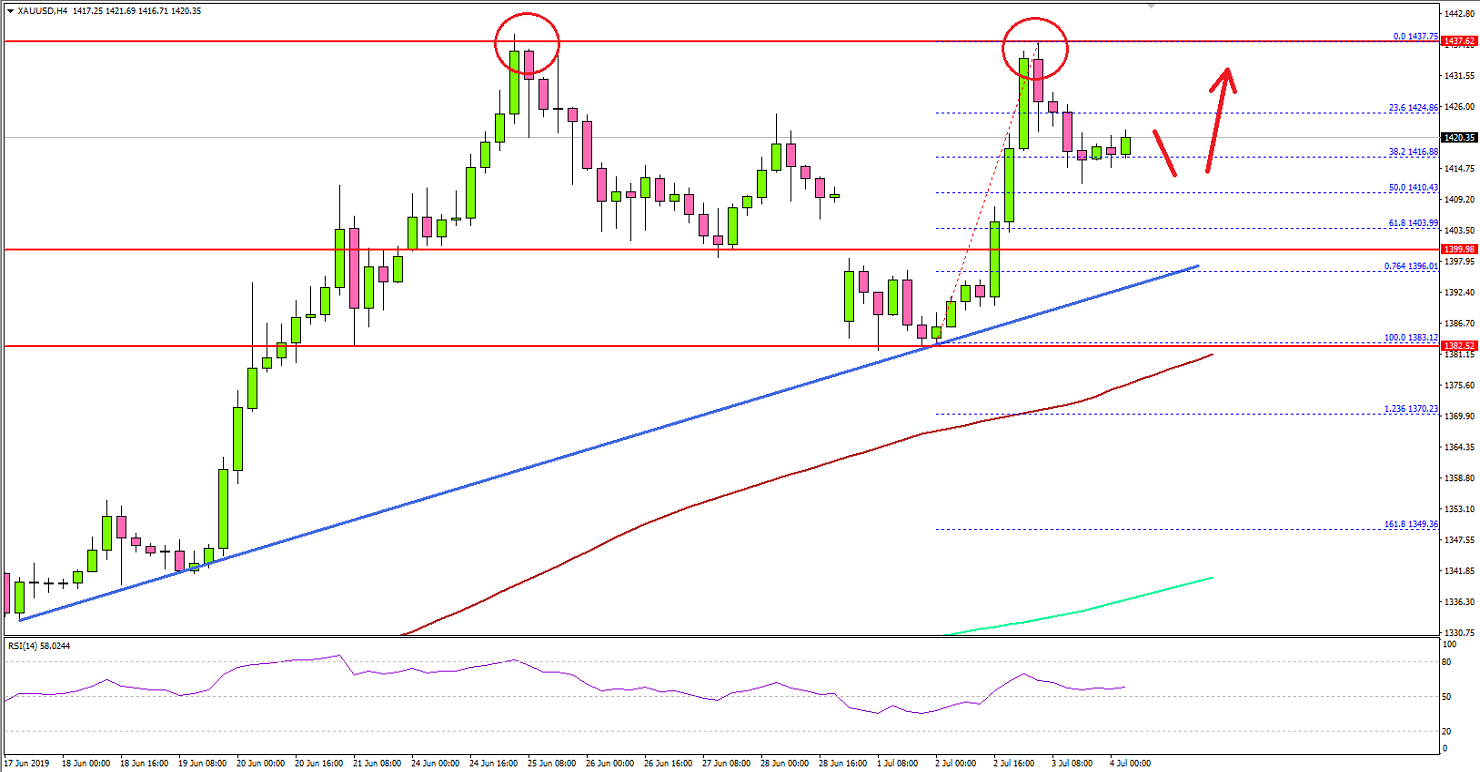
The 4-hours chart of XAU/USD indicates that the price toppednear the $1,437 level and recently started a fresh downside correction. Therewas a break below the $1,430 level to start the recent correction.
The price traded below the 23.6% Fib retracement level ofthe last wave from the $1,383 low to $1,437 high. However, there are manysupports on the downside near the $1,410, $1,400 and $1,395 levels.
An immediate support is near $1,410 plus the 50% Fibretracement level of the last wave from the $1,383 low to $1,437 high.Moreover, there is a major bullish trend line forming with support near $1,396on the same chart.
Therefore, dips towards the $1,400 and $1,395 levels remainwell supported. To move into a bearish zone, gold price must settle below$1,380 plus the 100 simple moving average (4-hours, red).
On the upside, the main hurdle for the bulls is near the$1,435 and $1,440 levels. If there is an upside break above $1,440, the pricecould easily rise towards the $1,450 and $1,460 levels.
Fundamentally, the US ADP Employment change figure wasreleased by the Automatic Data Processing, Inc. The market was looking for an increaseof 140K in June 2019, more than the last 27K.
However, the actual result was less than the marketforecast, as the private-sector employment increased by 102K from May to June,on a seasonally adjusted basis. Besides, the last reading was revised up from27K to 41K.
Commenting on the report, the vice president and co-head ofthe ADP Research Institute, Ahu Yildirmaz, stated:
Job growth started to show signs of a slowdown. While large businesses continue to do well, small businesses are struggling as they compete with the ongoing tight labor market.
The report was weak, but the US Dollar managed to hold the ground and pairs such as EUR/USD and GBP/USD extended losses in the past few sessions.
Economic Releases to Watch Today
- Swiss CPI for June 2019 (YoY) – Forecast +0.5%,versus +0.6% previous.
- Euro Zone Retail Sales for May 2019 (YoY) -Forecast +1.6%, versus +1.5% previous.
- Euro Zone Retail Sales for May 2019 (MoM) -Forecast +0.3%, versus -0.4% previous.
